Stock Optimisation Report
The Stock Optimisation report enables you to balance the capital investment constraints or objectives and service-level goals over a large assortment of stock-keeping units (SKUs) while taking demand and supply volatility into account. It enables to identify the status of the stocks at stores and provide information on any surplus available.
To generate stock optimisation report:
1. In the RPM menu, click Reports and then click Stock Optimisation.
The Stock Optimisation Report screen is displayed.
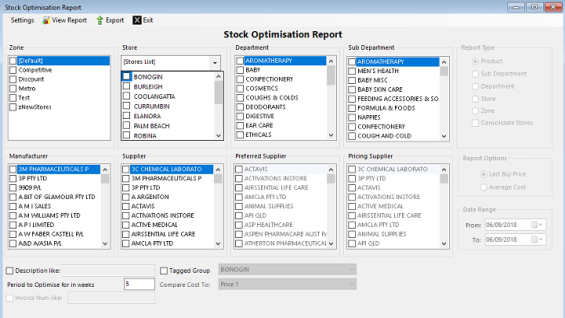
2. Select the required filters.
3. Select the appropriate Report Type.
4. Select one of the Report Options:
- Last Buy Price: This option displays the price that the stores last paid for the products to the supplier.
- Average Cost: This option displays the average cost of the of the products for various stores.
5. Select the other required filters.
6. Select View Report to view the report.
The Stock Optimisation Report will be generated.
Sample of Stock Optimisation Report
The fields displayed in the sample report can vary depending on your selection. The items displayed have been described in the table below.
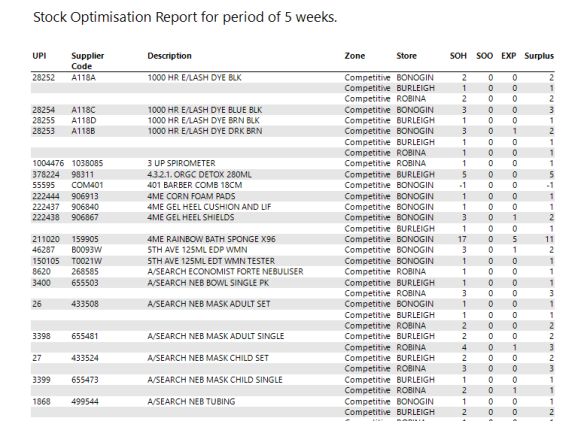
| Columns | Descriptions |
|---|---|
|
UPI |
The UPI number of the product. |
|
Supplier Code |
The supplier code of the product. |
|
Description |
The description of the product. |
|
Zone |
The name of the zone associated with the store. |
|
Store |
The name of the store where product is sold. |
|
SOH |
The amount of stock on hand. |
|
SOO |
The amount of stock on order. |
|
EXP |
The expected sales of the store for current month. |
|
Surplus |
Surplus is calculated as: Current SOH−(Expected Sales per Week ×No. of Weeks to Optimise for). Expected Sales per Week is calculated as: EXP×12/52 (as above EXP is the expected sales per month, this is turned into a weekly value). |