
The Sales Comparison report enables you to compare the total sales and quantity of the products during the specified date range over the previous year data for the same date range.
To generate the sales comparison report:
1. In the RPM menu, click Reports and then click Sales.
2. Select Sales Comparison.
The Sales Comparison screen is displayed.
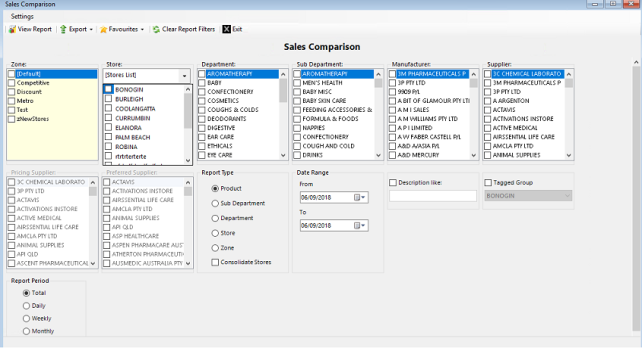
3. Select the require filters.
4. Select the appropriate Report Type.
5. Select the other required filters and specify the Date Range.
6. Select one of the following Report Period:
- Total: The total sales during the specified date range compared with the sales of defined period for previous year. It then calculates the variance allowing you to compare the sales between different period.
- Daily: The total sales of each day individually compared with the total sales of each day for previous year. It then calculates the variance between different period over the different year.
- Weekly: The total sales of each week individually compared with the total sales of each week for previous year. It then calculates the variance between different period over the different year.
- Monthly: The total sales for each month individually compared with the total sales of each month for previous year. It then calculates the variance between different period over the different year.
NOTE
To generate standard report, select Total and if you select Daily, Weekly or Monthly then the report will be automatically exported to Microsoft Excel.
7. Select View Report to view the report.
The Sales Comparison report will be generated.
Sample of Sales Comparison Report
The fields displayed in the sample report can vary depending on your selection. The items displayed have been described in the table below.
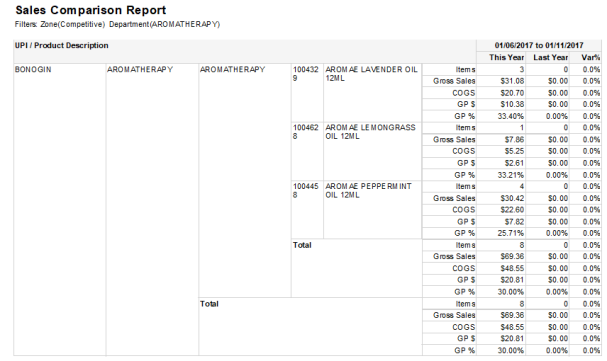
| Columns | Descriptions |
|---|---|
|
UPI/Product Description |
The UPI number of the product or the description of the product. |
|
Items |
The number of items sold this year and last year and the variance between the two years. |
|
Gross Sales |
The total sales of the item this year and last year and the variance between the two years. |
|
COGS |
The cost of sales for items for this year and the last year and the variance between the two years. |
|
GP $ |
The gross profit generated by the items for this year and last year and the variance between the two years, calculated as: (Nett Sales+Govt. Rec.−COGS)/(Nett Sales+Govt. Rec.) |
|
GP % |
The gross profit generated by the items for this year and last year in percentage and the variance between the two years. |
|
Var% |
The variance between this year and last year in percentage. |