
The Department Analysis report enables you to view the sales data for each Department or Sub Department for both ethical and OTC with a total at the end.
To generate the department analysis report:
1. In the RPM menu, click, Reports and then click Sales.
2. Select Department Analysis.
The Department Sales Analysis screen is displayed.
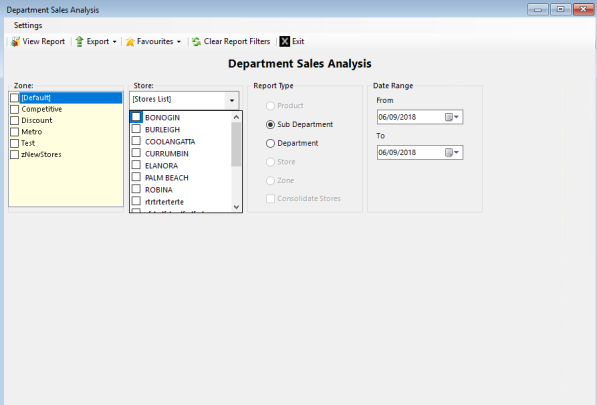
3. Select the Zone and Store.
4. Select one of the available Report Type.
5. Specify the Date Range within which the report needs to be generated.
6. Select View Report to view the report.
The Department Analysis report will be generated.
Sample of Department Analysis Report
The fields displayed in the sample report can vary depending on your selection. The items displayed have been described in the table below.

| Columns | Descriptions |
|---|---|
|
Department |
The name of the Department. |
|
Sub Department |
The name of the Sub Department. |
|
Items |
The number of items sold in Department or Sub Department during the specified date range. |
|
Sales Ex GST |
The amount of sales on the items sold in Department or Sub Department during the specified date range in dollar. |
|
Govt Recovery |
The value of government recovery received based on scripts of the products from Department or Sub Department. |
|
Total Sales |
The amount of total sales on the products sold in Department or Sub Department during the specified date range in dollar. |
|
Avg Sales |
The average amount of sales on the product sold in Department or Sub Department during the specified date range in dollar. |
|
Profit |
The amount of profit made on the sales of products in Department or Sub Department during the specified date range in dollar, calculated as: Sales (Excluding GST)−Government Recovery. |
|
GP% |
The gross profit generated on sales of the product in Departments or Sub Departments during the specified date range in percentage. |
|
% of Total |
The percentage of sales in the Department or Sub Department during the specified date range. |