
The Best/Worst Seller report lets you select one of the four types of report (three on best sales data, and one on worst sales data), along with a date range option and up to eight fields to be used at filters.
To generate the best or worst seller report:
1. In the RPM menu, click Reports and then click Best/Worst Seller.
The Best/Worst Seller screen is displayed.
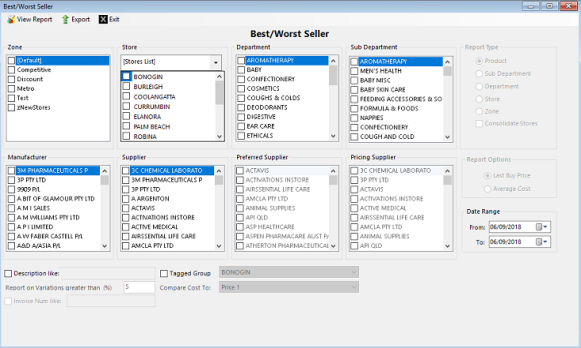
2. Select the required filters.
3. Select the Date Range and other required filters.
4. Select View Report.
The Best/Worst Seller Report dialogue is displayed.
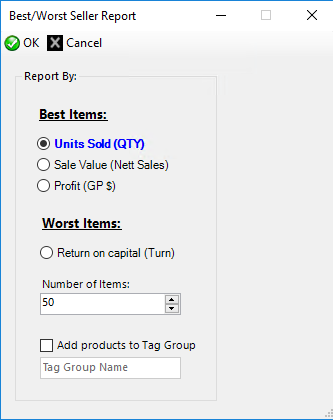
5. Select the following options:
- Unit Sold (QTY): This option displays the quantity of the Products sold per unit. The more the Product sold the better the performance of the Product.
- Sale Value (Nett Sales): This option displays the total retail Sales of the Products excluding GST.
- Profit (GP $): This option displays the best gross profit of the Products in dollars.
- Return on capital (Turn): This option displays the return on capital for the Products. The lower the return on capital the worst the performance of Product.
- Number of items: This option displays the selected number of items. The default number is 50 and maximum is 10,000.
- Add products to Tag Group: This option enables you to add the tagged group name.
6. Select OK to view the report.
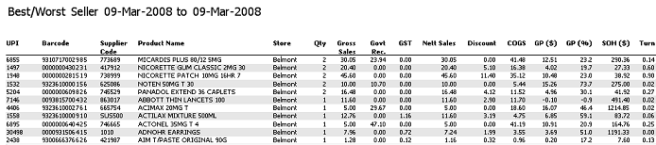
The Best or Worst Seller report will be generated.
Sample of Best or Worst Seller Report
The fields displayed in the sample report can vary depending on your selection. The items displayed have been described in the table below.
| Column | Descriptions |
|---|---|
|
UPI |
The UPI number of the Products. |
|
Barcode |
The primary barcode number of the Products. |
|
Supplier Code |
The supplier code of the Products based on the Pricing Supplier selected in Head Office options. |
|
Product Name |
The name of the Products. |
|
Store |
The name of the Stores. |
|
Qty |
The number of Products sold within the date range. |
|
Gross Sales |
The total sales of the Products during the period including GST. |
|
Govt Rec. |
The government recovery received based on scripts dispensed. |
|
GST |
The amount of GST charged on the Products during the period. |
|
Nett Sales |
The total sales of the Products excluding GST. |
|
Discount |
The amount of discount applied to the Products during the period. |
|
COGS |
The total cost of sales of the items during the period. |
|
GP ($) |
The gross profit in dollars calculated as: (Nett Sales+Govt. Rec.−COGS)/(Nett Sales+Govt. Rec.) |
|
GP (%) |
The gross profit as a percentage. |
|
SOH ($) |
The value of stock on hand in dollars calculated as: Current SOH × Last Buy Price. |
|
Turn |
The turn stock of the Products calculated as: Total Cost/SOH($). |