
The Store Sales Total report enables you to view the detailed report on the total sales of the store during the specified time period.
To generate store sales total report:
1. In the RPM menu, click Reports and then click Store Sales Total.
The Store Sales Totals screen is displayed.
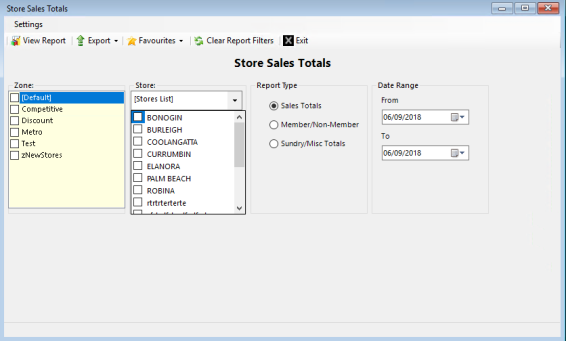
2. Select Zone and Store.
3. Select one of the following Report Type:
- Sales Totals: This option displays the total sales of the store within the specified date range.
- Member/Non-Member: This option displays the total sales within the specified date range for member or non-member.
- Sundry/Misc Totals: This option displays Abandoned Sales, Paid Out, Agency Payments, Account Payments, Lay-By Payments, Misc Transactions, and GST on Misc for the stores during the defined time period.
4. Specify the Date Range within which the report needs to be generated.
5. Select View Report to view the report.
The Store Sales total report will be generated.
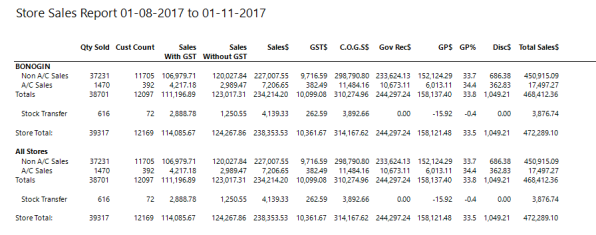
Sample of Store Sales Report
The fields displayed in the sample report can vary depending on your selection. The items displayed have been described in the table below.
| Columns | Descriptions |
|---|---|
|
Qty Sold |
The number of items sold at specific stores during the defined time period including account sales, non-account sales and stock transfers. |
|
Cust Count |
The number of customer who made the transaction during the defined time period. |
|
Sales With GST |
The sales generated including GST rate of 10% during the specified date range. |
|
Sales Without GST |
The sales generated without including GST during the specified date range. |
|
Sales $ |
The total sales generated during the specified date range with or without including GST in dollar. |
|
GST $ |
The amount of GST incurred during the specified date range in dollar. |
|
C.O.G.S $ |
The cost of sales of the items during the specified date range in dollar. |
|
Gov Rec $ |
The government recovery received based on the script of the products from the Departments or Sub Departments. |
|
GP $ |
The gross profit generated in dollar during the specified date range, calculated as: (Nett Sales+Govt. Rec.−COGS)/(Nett Sales+Govt. Rec.) |
|
GP % |
The gross profit generated during the specified date range in dollar. |
|
Disc $ |
The total amount of discount applied to the sales during the defined time period. |
|
Total Sales $ |
The overall total sales of the product during the specified date range in dollars. |