
The Price Change Report enables you to view the variance in prices during the specified date range for items in mark-up and gross profit.
To generate price change report:
1. In the RPM menu, click Reports and then click Price Changes Report.
The Price Changes Report screen is displayed.

3. Select the required filters.
4. Select the other required filters and specify the Date Range.
5. Select View Report to view the report.
The Price Changes report will be generated.
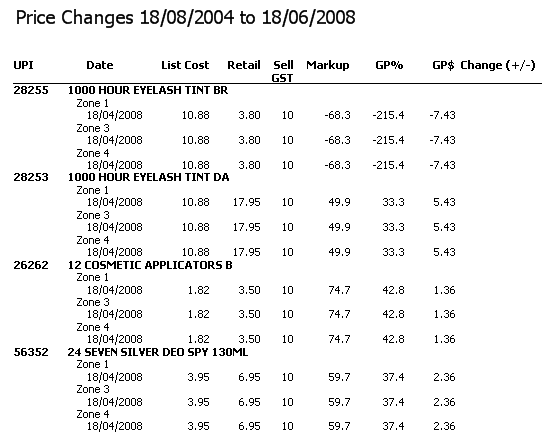
Sample of Price Changes Report
The fields displayed in the sample report can vary depending on your selection. The items displayed have been described in the table below.
| Columns | Descriptions |
|---|---|
|
UPI |
The UPI number of the Products. |
|
Date |
The date of the price change. |
|
List Cost |
The list cost of the Product at the time of price change. |
|
Retail |
The new retail price of the Products. |
|
Sell GST |
The amount of GST applied on the Product sold. |
|
Markup |
The percentage markup of the Product calculated as: (Retail−List Cost)/List Cost |
|
GP % |
Gross profit generated during the specified period in percentage. |
|
GP $ |
The gross profit generated during the specified period in dollar, calculated as: (Nett Sales + Govt. Rec. – COGS)/(Nett Sales + Govt. Rec.) |
|
Change (+/–) |
Indicates whether the retail price change is increased, decreased or remain same as compared to the previous retail price, calculated as: Percentage change from the previous retail price. The column will show either plus (+) or minus (−) values depending on the price change. |